Statistical geeky look at D1NZ
I’ve had a quiet weekend around the house looking after the kids, so I thought I would have a look back over the just passed D1NZ season to see what sort of stats I could find that might be of interest. There are always a few things that come out that haven’t been obvious and I thought I might share a few things with you, while we work on a much bigger project. It’s a very american way to look at the sport, but as we continue to evolve it may well become more of a factor.
Qualifying-
Here are the driver averages based on top score each round . You’ll note that a couple of drivers have 2 scores, that was just to see what happened if in the case of SVG etc you averaged them only over the rounds they did.
| Round 1 | Round 2 | Round 3 | Round 4 | Round 5 | Round 6 | Average score | less DNS rounds | |
| Daniel Woolhouse | 77 | 85 | 83 | 80 | 79 | 82.5 | 81.1 | |
| Mike Whiddett | 85 | 54 | 88 | 84 | 83.2 | 82 | 79.4 | |
| Gaz Whiter | 67 | 84 | 88 | 68 | 84 | 81 | 78.7 | |
| Andrew Redward | 74 | 83 | 83 | 75 | 85 | 69.5 | 78.3 | |
| Troy Forsythe | 64 | 73 | 83 | 82 | 80.5 | 70 | 75.4 | |
| Curt Whittaker | 66 | 76 | 78 | 77 | 71.5 | 81.5 | 75.0 | |
| Daynom Templeman | 82 | 79 | 68 | 70 | 86.5 | 62.5 | 74.7 | |
| Zak Pole | 65 | 75 | 82 | 78 | 78 | 69 | 74.5 | |
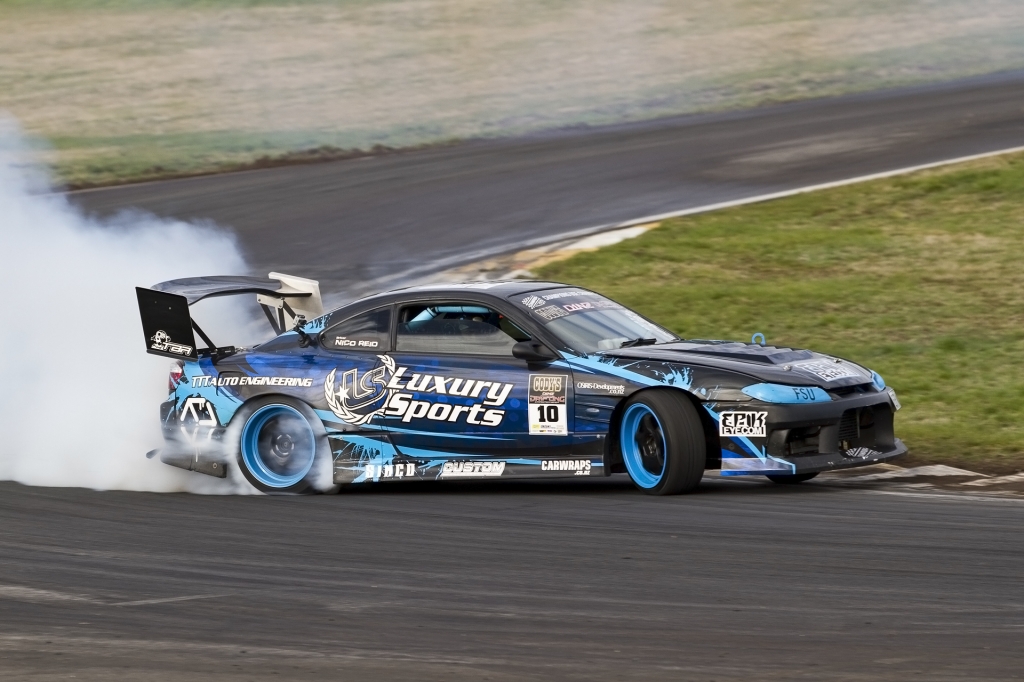
| Nico Reid | 62 | 77 | 74 | 90 | 65 | 78.5 | 74.4 | |
| Bruce Tannock | 80 | 65 | 79 | 80 | 67 | 67.5 | 73.1 | |
| Ben Belcher | 76 | 60 | 48 | 76 | 76 | 69.5 | 67.6 | |
| Cole Armstrong | 74 | 74 | 79 | 86 | 0 | 72 | 64.2 | 77 |
| Drew Donovan | 48 | 55 | 59 | 69 | 72.5 | 71 | 62.4 | |
| Cody Collis | 38 | 64 | 58 | 67 | 83.5 | 54 | 60.8 | |
| Brad Lauder | 79 | 73 | 69 | 64 | 0 | 66 | 58.5 | 70.2 |
| Sky Zhao | 61 | 72 | 52 | 62 | 68 | 34 | 58.2 | |
| Kyle Jackways | 56 | 37 | 50 | 76 | 65 | 65 | 58.2 | |
| Gary Tenana | 63 | 0 | 64 | 71 | 79 | 66.5 | 57.3 | |
| Cam Vernon | 65 | 71 | 50 | 54 | 75 | 0 | 52.5 | 63 |
| Robee Nelson | 52 | 74 | 48 | 0 | 62 | 71 | 51.2 | 61.4 |
| Shane Allen | 0 | 70 | 58 | 61 | 52 | 63 | 50.7 | |
| Jason Sellers | 0 | 84 | 70 | 66 | 72 | 0 | 48.7 | 73 |
| Shane Van Gisbergen | 37 | 0 | 71 | 0 | 83.5 | 72.5 | 44.0 | 66 |
| William Foster | 66 | 50 | 57 | 0 | 0 | 70 | 40.5 | 60.75 |
| Carl Ruiterman | 60 | 73 | 0 | 0 | 0 | 74 | 34.5 | 69 |
| Hugo Maclean | 57 | 0 | 50 | 56 | 0 | 0 | 27.2 | 40.75 |
| Chris trundle | 66 | 71 | 0 | 0 | 0 | 0 | 22.8 | |
| Mac Kwok | 62 | 75 | 0 | 0 | 0 | 0 | 22.8 | |
| Aden Omnet | 0 | 67 | 63 | 0 | 0 | 0 | 21.7 | |
| Jonny Latham | 52 | 0 | 0 | 0 | 63.5 | 0 | 19.3 | |
| Phil Sutherland | 0 | 0 | 0 | 0 | 80 | 0 | 13.3 | |
| Chris Jackson | 0 | 0 | 0 | 0 | 78 | 0 | 13.0 | |
| Jonny Udy | 0 | 0 | 0 | 77 | 0 | 0 | 12.8 | |
| Tom Hadlee | 0 | 0 | 0 | 0 | 76 | 0 | 12.7 | |
| Paul Tomlin | 0 | 0 | 0 | 0 | 75 | 0 | 12.5 | |
| Guy Kerr | 0 | 0 | 0 | 0 | 65 | 0 | 10.8 | |
| Andrew Gnad | 0 | 0 | 0 | 0 | 64 | 0 | 10.7 | |
| Lyndsay Lasson | 0 | 0 | 0 | 0 | 63.5 | 0 | 10.6 | |
| Jarrod Reid | 0 | 0 | 0 | 0 | 62 | 0 | 10.3 | |
| Joel Counter | 0 | 0 | 0 | 0 | 60 | 0 | 10.0 | |
| Sean Falconer | 0 | 0 | 60 | 0 | 0 | 0 | 10.0 | |
| Carlos Walters | 53 | 0 | 0 | 0 | 0 | 0 | 8.8 | |
| Andrea Paraskevas | 0 | 0 | 0 | 51 | 0 | 0 | 8.5 | |
| James Hopman | 0 | 0 | 0 | 0 | 48 | 0 | 8.0 | |
| Shane Rutland | 26 | 0 | 0 | 0 | 0 | 0 | 4.3 | |
| Darren Benjamin | 0 | 0 | 0 | 0 | 0 | 0 | 0.0 | |
| Ryan Johnson | 0 | 0 | 0 | 0 | 0 | 0 | 0.0 |
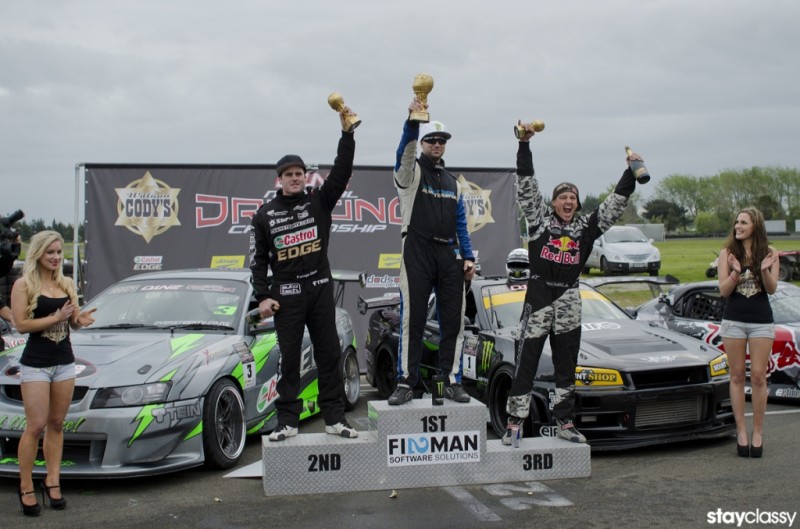
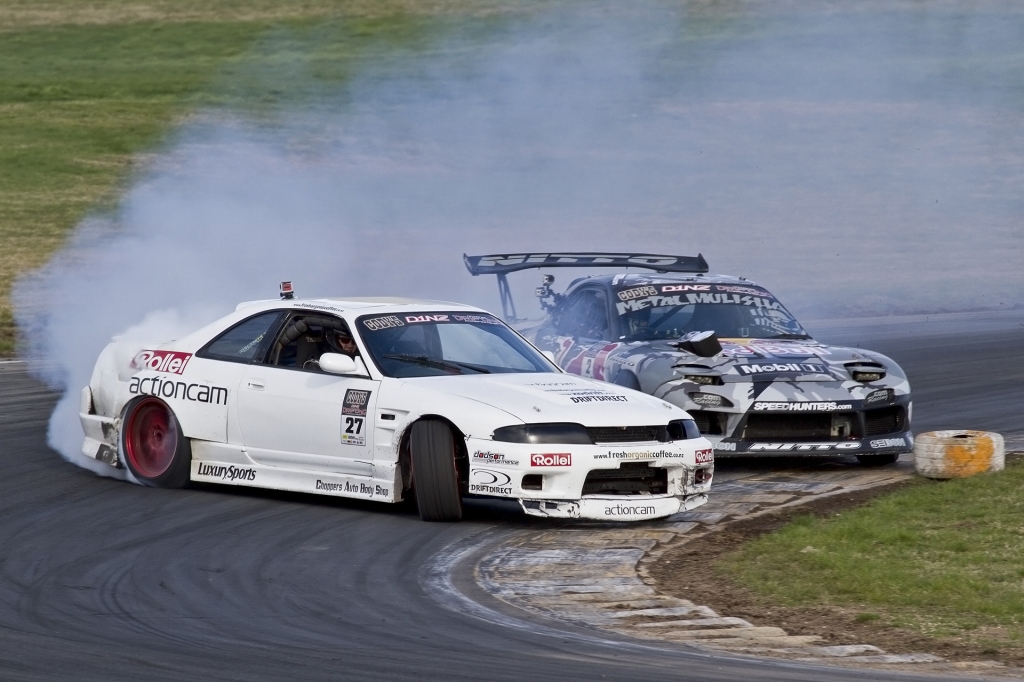
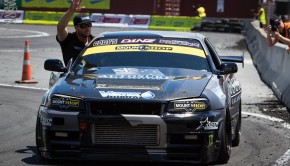
As you can see, champion Fanga Dan had a very consistent season that ensured he lead a majority of his battles, while there was a notable impact on Mad Mike as he has talked about due to the mechanical failure of the RX8 in its first appearance of the year. Gaz Whiter had a major impact on his scores due to the loss of his LS2 at Hampton, while Andrew Redward was strangely out of sorts during the Taupo final round.
Only 1 driver managed to get scores for every single one of their 18 qualifying passes this season, and that was Drew Donovan. Next best were Daynom Templeman and Nico Reid with 4 rounds without an error or mechanical.
The closest scoring round in terms of small differences separating the top end was interestingly the brand new track at Tauranga, while Manfield continues to be a bogey start to the season for many, and it almost looks like perhaps the judges take a while to warm into the season. Some have also questioned how harsh the taupo round appeared but no matter how you look at it, the judges are the same for all drivers so the results wouldn’t be effected.
The lowest score recorded that got a driver into the field was 26 for Shane Rutland in round 1, while Single highest score for the season was Nico Reid with a 90 at Hampton downs,who also hold the distinction of being 1 of 2 #1 qualifiers to go out in the top 16 round along with Daynom Templeman.
Looking at the other end of the field, only 2 drivers did multiple events and didn’t progress beyond the top 32 – Aden Omnet and Johnny Latham.
Curt Whittaker was the driver this season who went from the lowest qualifying result ( 10th) to win a round, which perhaps shows just how hard it is if you are not getting up into those top spots.
Round winners came from #1 twice, #3 twice, 6th place and Curt’s 10th at round 1.
The biggest mover in terms of qualifying low to end result belongs to Hugo Maclean, who went from 25th at Tauranga to grab his first ever podium spot in 3rd. Beating the current DK along the way, this many expected would herald the arrival of Hugo as a force, but a chance in direction saw him skip some events and focus on offshore opportunities.
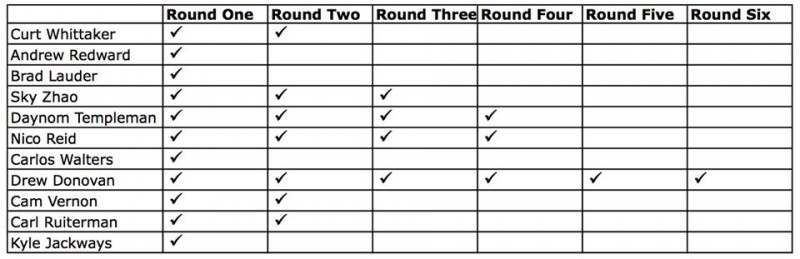
Facing the same opponent a number of times in battle is another challenge that rears its head over the course of a season, and while some rivalries get a lot of coverage, others tend to go a bit un-noticed. 3 drivers faced the same opponent on at least 3 occasions being Mad Mike, Nico Reid and Troy Forsythe, while several had the same opponent twice. The later 2 I think have the makings of a great rivalry given how close the teams are as friends, which leads to a strong level of trust in each others driving.
One More time battles is something else that might be of interest to people. I would take a guess that one of the drivers there will be no surprise in this category in Zak Pole, who established his pedigree by having a couple of very tough battles with the Redbull RX7, but it may also be a shock to some that series champ Fanga Dan was made to work very hard and also had to take part in an equal number of One more time battles.
47 drivers entered D1NZ’s pro class this season, however most events had an average of 25 drivers. Numbers are inflated by a large number of single event entries for Ruapuna.
Most of the D1NZ road cone crew (photographers) shoot an average of 2000 shots – that’s 12,000 images per season x 25 regular guys and girls producing 300,000 images of D1NZ drivers. That doesn’t include the extras and all the #selfies the WAGS take , so its safe to say a half a million shutter clicks or more happen.
SBPnz shot about 40 hours of video footage to produce the 120mins of highlights you’ve seen so far.
Average crowd attendance across the events was 5000 people
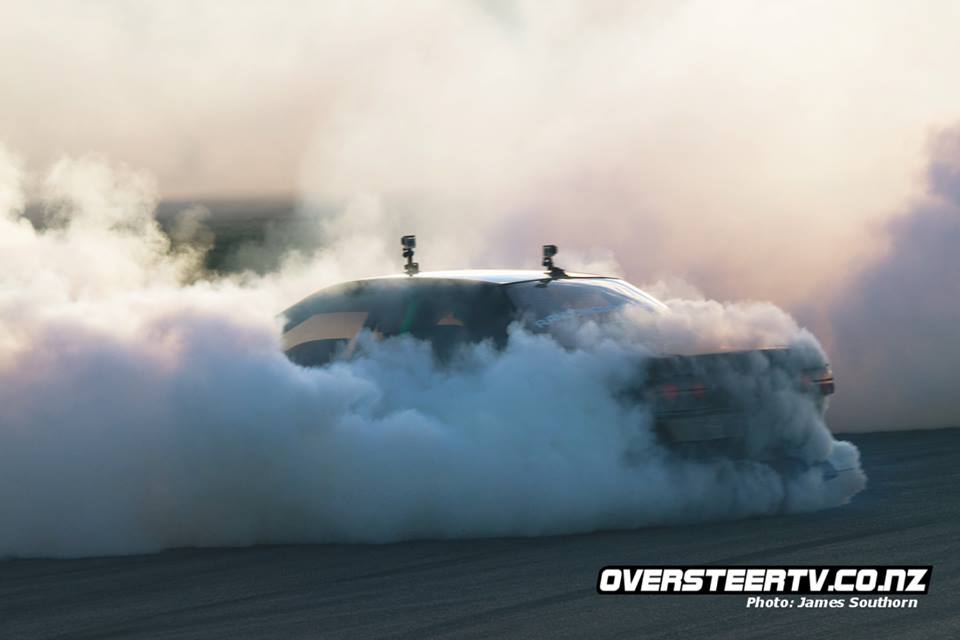
Drivers use on average 12 tires per event at $130 average for a 265 width x 25 drivers = $39,000 worth of tires destroyed per event.
That’s about it for now, but if there is something else of interest then let me know.
Related Posts
Whittaker Motorsport formalize partnership with Rattla Motorsport →
Gaz Whiter R1 Season 2013 onboard →
Van Gisbergen takes Rattla to the podium →